Macro Stress Map: Energy, Credit & Risk Aversion
Topix 100 Exposure Analysis

Heading 1
Heading 2
Heading 3
Heading 4
Heading 5
Heading 6
Lorem ipsum dolor sit amet, consectetur adipiscing elit, sed do eiusmod tempor incididunt ut labore et dolore magna aliqua. Ut enim ad minim veniam, quis nostrud exercitation ullamco laboris nisi ut aliquip ex ea commodo consequat. Duis aute irure dolor in reprehenderit in voluptate velit esse cillum dolore eu fugiat nulla pariatur.
Block quote
Ordered list
- Item 1
- Item 2
- Item 3
Unordered list
- Item A
- Item B
- Item C
Bold text
Emphasis
Superscript
Subscript
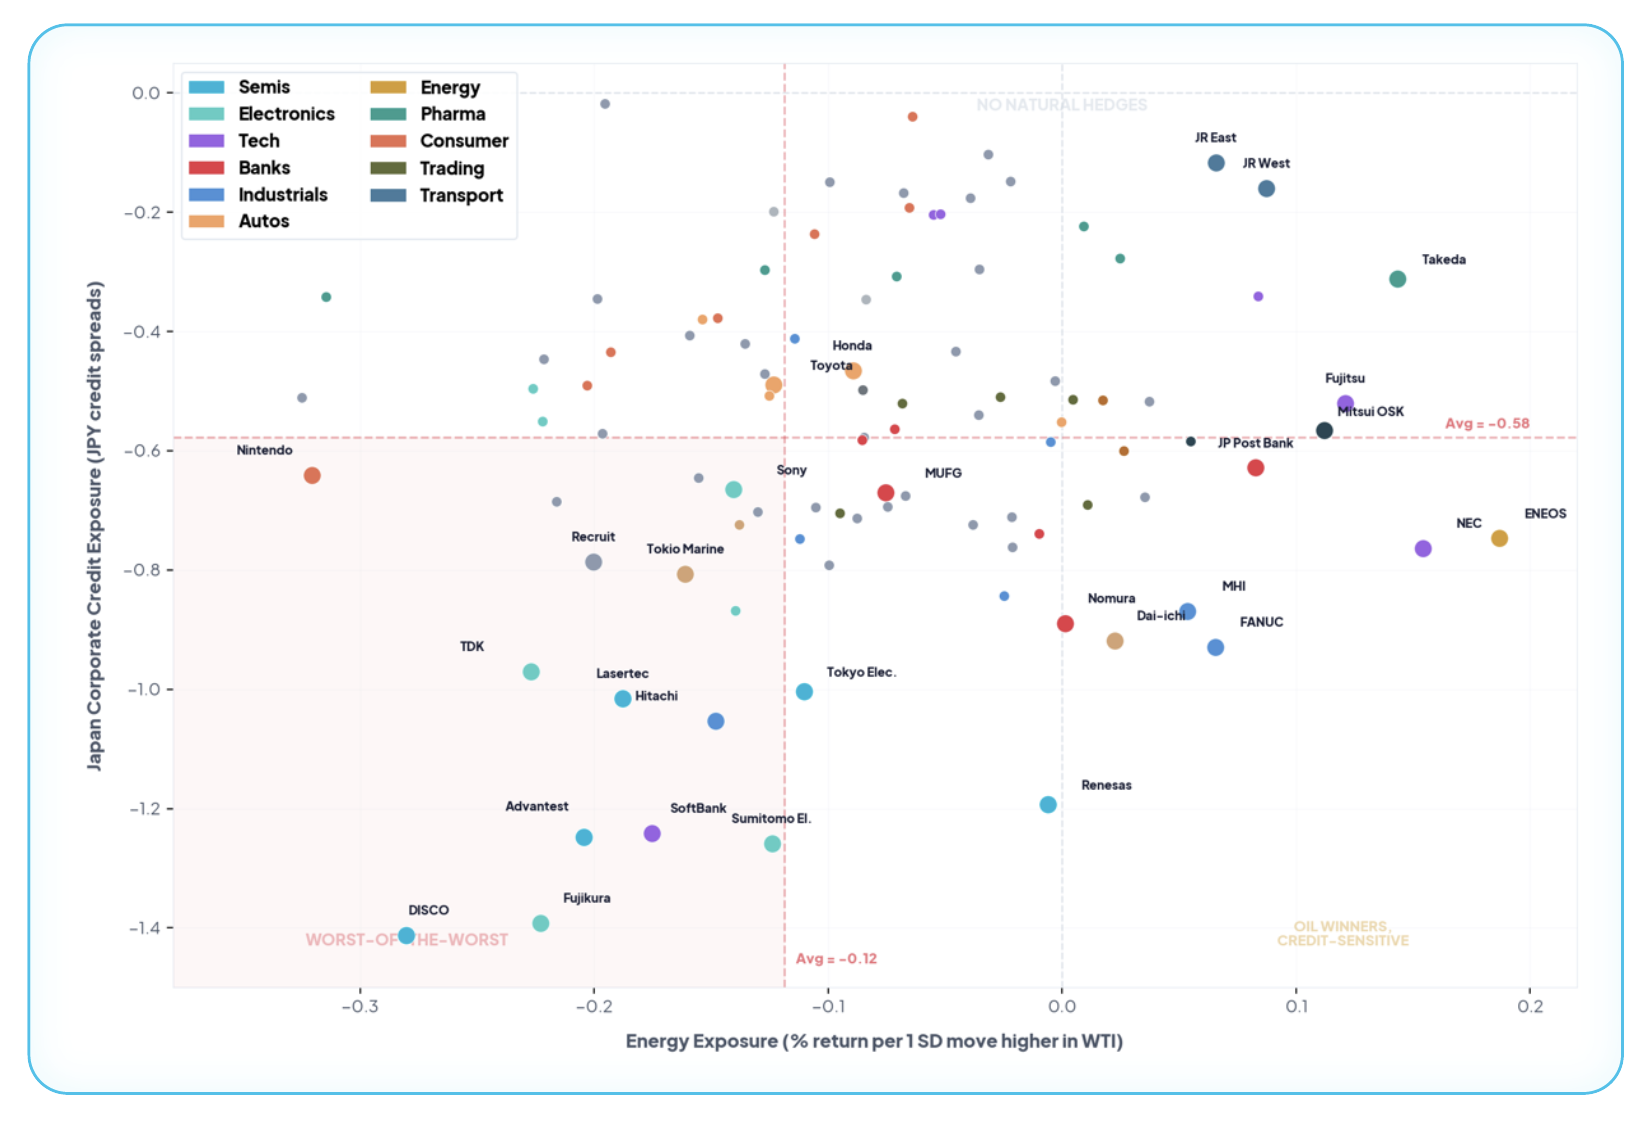
Objective: To quantify how a simultaneous positive shock to: WTI crude, Japan corporate credit spreads, implied volatility, would transmit through Topix 100 constituents using MFERM exposures as of 6 March 2026. The result is stark: every single name in the Topix 100 has negative Japan Corporate Credit exposure. There are zero natural hedges. 77 stocks are hurt by both higher oil and wider spreads. The only nuance is a handful of names with positive Energy exposure and manageable credit drag.
Energy vs. Japan Corporate Credit: The Full Map
X-axis = Energy (WTI) exposure. Y-axis = Japan Corporate Credit (JPY credit spreads) exposure.Red dashed lines = average negative exposure thresholds. Every name sits below zero on theY-axis — no stock benefits from wider Japanese credit spreads.
Continue reading our analysis by downloading the PDF above

Related Articles
Do your risk models really cover macro?
Regime Change in US Equities: Why AI Stock Risk Now Runs Through Credit

Best Macro Factor Risk Models for Institutional Investors
in 2026

How to Build a Macro-Aware Equity Portfolio in 2026:
A Knowledge Guide