1. Sector book-end: Healthcare vs. Inflation
2. Exploring "SellAmerica" in credit - US IG vs. EU Main
3. Geographical book-ends: VNM vs. KSA

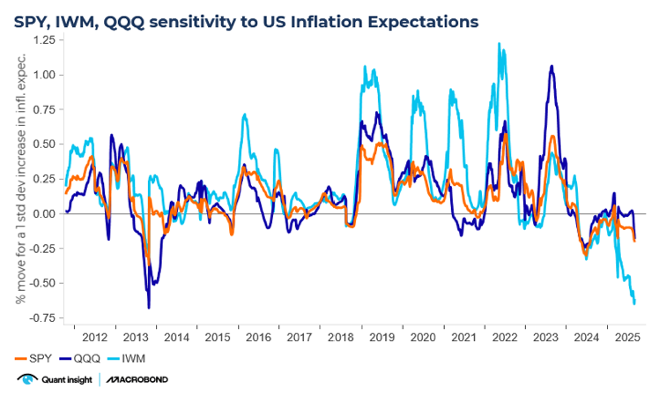
1. Small Cap rotation is hostageto inflation
2. Rate Volatility - the BlindSpot in Equity Risk
3. Rising Rate Vol - the AchillesHeel of IBB
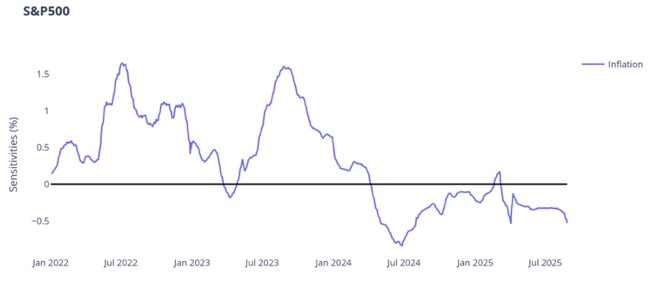
1. Sector Book-end: Healthcare vs. Inflation
One of the worst performing sectors in the S&P500 YTD and over the last 1yr has been Healthcare – reflecting in large part the policy uncertainty around drug pricing and Medicare reforms. It has taken the relative 12mth fwd PE of thesector vs. the S&P500 to the bottom of its multi-year range.
On Qi’s Valuation Model the sector (XLV) trades at -1.5 sigma above Qi modelfair value, its 13th percentile over the last 1yr. It has fallen ~4%YTD.

According to Qi,the dominating macro factor leading to US healthcare underperformance is higher inflation expectations – the sensitivity is at multi-year negative extremes. Inother words, inflation erodes already thin operating margins.
However, again if tariff uncertainty abates dampening inflationary concerns, Healthcare would bethe laggard due for some catch-up.

2. Exploring “Sell America” in credit – CDX IG vs.EU Main
For the first time since early 2022 and the start of the Fed hiking cycle, Qi's model of US versus European Investment Grade credit shows macro-warranted model value as positive, i.e. US spreads should trade wider (not tighter) than their European peers.
The chart below is distorted by the huge moves early in April. CDX IG spreads peaked on April 8th and narrowed around 13bp on the 9th. EU Main continued to widen on April 9th. That rare divergence only lasted one day before the two resumed moving together, but it meant the x-mkt spread experienced a 20bp swing in 24 hours.

Looking past that noise the standout is the move up in the blue line - Qi's model value. Essentially, for years macro conditions supported CDX IG trading through EUMain. Today the broad macro environment suggests US IG spreads should trade 2bp over their EU peers.
There are early signs of a divergence pattern - the market is lagging this macrore-pricing. Right now the FVG is only modest but the shift in macro momentum itself is striking.
3. Geographical book-ends: VNM vs. KSA
Valuation Model shows two clear book-end scanning across globalequities.
The Vaneck Vietnam ETF (VNM) trades at +2.2 sigma above Qi model fairvalue, its 98th percentile over the last 1yr. It has rallied ~22%YTD.

The iShares MSCI Saudi Arabia ETF (KSA)trades at -2.5 sigma below Qi model fair value, its 2nd percentile over the last 1yr. It has fallen ~-7% YTD.

A key factor dictating relative performance has been the Dollar – Vietnam benefiting from tariff noise / supply chain relocation from China; whereas less tariff noise / policy uncertainty will in contrast support energy prices and, in turn, the Dollar.
Given the Qi Valuation extremes, it is emphasising that compartments of the global equity market will likely seemeaningful mean-reversion if the Dollar, a barometer of policy uncertainty, canstabilise.


.png)