1. JPXN -Near Term Overextended
2. US Consumer Discretionary - Model Momentum Waning
3. Viva Brazil! Just not at these levels

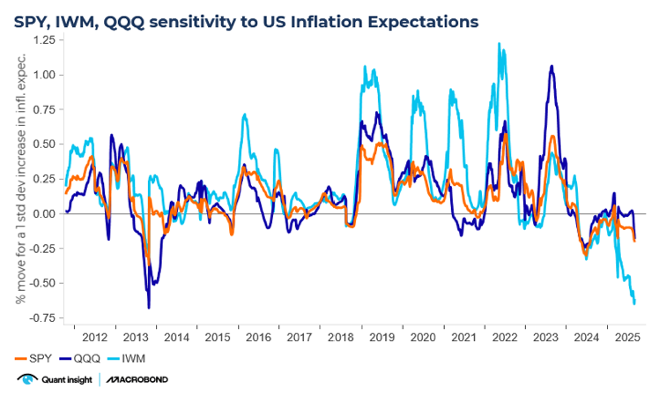
1. Small Cap rotation is hostageto inflation
2. Rate Volatility - the BlindSpot in Equity Risk
3. Rising Rate Vol - the AchillesHeel of IBB
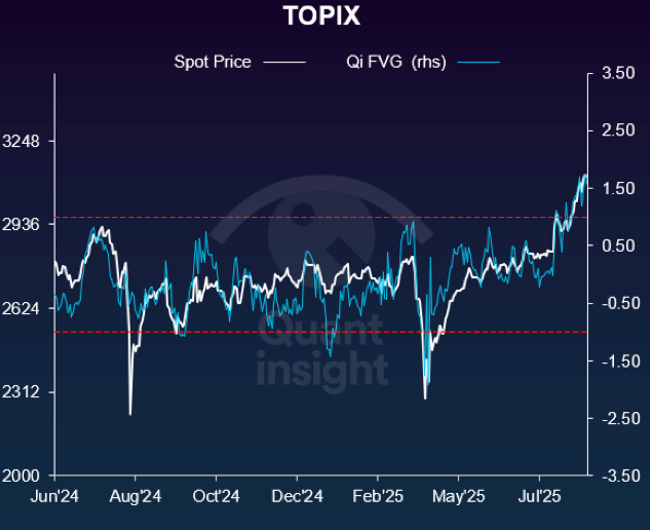
1. JPXN- Near Term Overextended
In Dollar terms, Japanese equities have outperformed the US by 14% ytd. Japan-US negotiations are underway and there has been underlying strength in domestic demand names, defensive stocks and strong Yen benefit stocks. Today, the JPXN ETF is making new YTD highs. Qi shows it benefits from a stronger JPY. Japanese assets are drawing in record inflows. See the first chart
This is reflected in JPXN FVG rising to +2 sigma and +1.5 sigma on Qi’s LT and STmodels, respectively – close to multi-year highs. Model price momentum has been rising but spot price action has moved ahead. We would caution not to chase here. See the second chart below, where we show the FVG over the last year overlaid with the spot price.


2. US Consumer Discretionary – Model Momentum Waning
Concerns are rising that tariff uncertainty will wreak havoc on supply chains with vendors starting to pass on price increases to customers. The resilience of the economy will be put to test. Powell has pretty much already said he will be late – the Fed has given no indication they will be pre-emptive. Markets will be on recession watch for the next 2-3mths. And the window maybe getting smaller if we start to see cracks in the hard data.
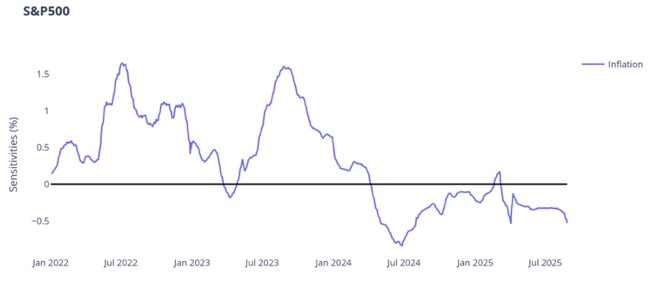
With this in mind, the Consumer Discretionary sector will be at the epicenter of any deterioration in the growth / inflation trade-off. The last week has been characterized by outperformance from higher beta Tech and Consumer stocks. However, Qi shows model momentum for the S&P Consumer Discretionary /S&P500 RV continues to wane, in contrast to price action. See the firstchart below.
What does outperformance require according to Qi? Higher 1y1y yields relative to spot (i.e. higher Fed rate expectations) and a stronger dollar – signs of greater economic confidence. On Qi’s models, the pair is +1.4 sigma above LT model value. In January, we hit > 2 sigma rich – a strong sell signal.Today, we would again remain cautious chasing these names. See the second chart.


3. VivaBrazil! Just not at these levels
Brazilis a popular play for a trade war – long equities, long the currency.
The typical thinking is during Trump’s 2018 tariffs, China switched its purchases of soybeans from the US to Brazil for example. With “just” 10% tariffs from theUS & a big agricultural sector, can it emerge as a beneficiary in the 2025re-ordering of global trade?
Makes sense but, as always, it depends what price you get in at, and at these levels,the risk-reward does not look compelling.
Qi’s fair value estimate comes with a health warning given low model confidence.However, it is notable how, after falling for much of 2025, over the last few weeks the macro cross-currents are now offsetting one another & keeping model value treading water around the 6.00 level.

April’s Dollar sell-off in has taken the cross 1.8 sigma (6.3%) cheap to macro conditions. Even dropping our normal RSq constraint, this is a rare occurrence– USDBRL has only been this cheap to macro 11x since 2009. The hit rate on those signals is 64% &, as per the chart below, the correlation between spot USDBRL & Qi’s FVG again points to the “right” kind of mean reversion.
Disclaimer
This document is being sent only to investment professionals (as that term is defined in article 19(5) of the Financial Services and Markets Act 2000 (Financial Promotion) OrdeRSq005 (“FPO”)) or to persons to whom it would otherwise be lawful to distribute it. Accordingly, persons who do not have professional experience in matters relating to investments should not rely on this document. The information contained herein is for general guidance and information only and is subject to amendment or correction. This document is not directed to, or intended for distribution to or use by, any person or entity who is a citizen or resident of or located in any locality, state, country or other jurisdiction where such distribution, publication, availability or use would be contrary to law or regulation.
This document is provided for information purposes only, is intended for your use only, and does not constitute an invitation or offer to subscribe for or purchase any securities, any product or any service and neither this document nor anything contained herein shall form the basis of any contract or commitment whatsoever. This document does not constitute any recommendation regarding any securities, futures, derivatives or other investment products. The information contained herein is provided for informational and discussion purposes only and is not and, may not be relied on in any manner as accounting, legal, tax, investment, regulatory or other advice.
Information and opinions presented in this document have been obtained or derived from sources believed to be reliable, but Quant Insight Limited (Qi) makes no representation as to their accuracy or completeness or reliability and expressly disclaims any liability, including incidental or consequential damages arising from errors in this publication. No reliance may be placed for any purpose on the information and opinions contained in this document. No representation, warranty or undertaking, express or implied, is given as to the accuracy or completeness of the information or opinions contained in this document by any of Qi, its employees or affiliates and no liability is accepted by such persons for the accuracy or completeness of any such information or opinions. Any data provided in this document indicating past performance is not a reliable indicator of future returns/performance. Nothing contained herein shall be relied upon as a promise or representation whether as to past or future performance.
This presentation is strictly confidential and may not be reproduced or redistributed in whole or in part nor may its contents be disclosed to any other person under any circumstances without the express permission of Quant Insight Limited.


.png)