One engine, two halves.
A quantitative, consistent and repeatable framework for the macro forces driving asset prices, updated daily across every asset class. Everything on this page is one of the two halves below.

A quantitative, consistent and repeatable framework for the macro forces driving asset prices, updated daily across every asset class. Everything on this page is one of the two halves below.
Prices the asset against macro factors, identifies its macro DNA, and monitors regime change. Model value is recalculated daily — it is not a price target and it is not a forecast.
Turns that price into a decision: momentum, dislocation, and the most efficient instrument for expressing a view.
asset classes: equities, rates, FX, commodities
nowcast refresh, no lagged releases
R² confidence range on every asset
access routes: API or the Qi screener
Every read starts with one question: is this asset actually being driven by macro right now, or is something else in the driver's seat? R² measures it directly.
High R² means macro conditions explain the bulk of price action. Low R² means idiosyncratic or event risk — earnings, M&A, geopolitics — has taken over, and the valuation read should be treated as colour rather than signal.
Regime shifts run both ways. An asset can sit out of regime for months, then hand control back to macro within weeks.

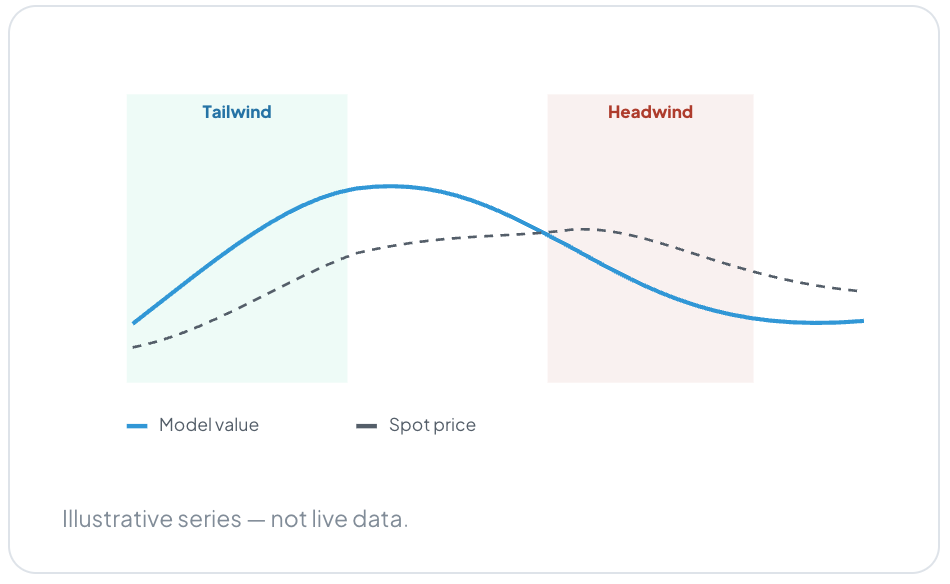
Model value is what current macro conditions alone warrant for the asset, recalculated every day. Read on its own — before any comparison to price — it is a momentum reading: whether the macro backdrop is turning supportive or hostile.
It routinely turns well before spot does. Model value can trend for months while price does something else entirely, and that relationship is where the fair value gap comes from.
Behind every model value sits a sensitivity profile: which factors the asset is exposed to, how large the exposure is and in which direction. Positive means the asset rises when the factor rises.
That profile is not fixed. Factor leadership rotates even while macro stays firmly in control — an asset can spend a quarter dominated by central bank policy, then hand leadership to risk appetite the next.
Know which factor is actually in control before you size a view, or hedge one.


Run the sensitivity profile in reverse. Start with a macro view, then screen the universe for whichever instrument carries the highest and cleanest sensitivity to that theme — one factor at a time, across equities, rates, FX and commodities.
Right idea, wrong instrument still loses money.
Spot minus model value, expressed in standard deviations — so a single threshold works across a Taiwan ETF and a Bund future alike — and shown in price or yield terms so the gap reads as a real, tradable level. ±1σ is the standard screening threshold; ±1.5σ marks the extremes.
A wide gap does not say which side is right. It says a gap exists. A gap is a flag, not a trade.

Getting from flag to P&L takes further work. Three filters do most of it
Catches price drifting away from fair value — the common setup, and the one the screening threshold is built around.
Catches macro, price and valuation turning together. A breakout signal: rarer, and stronger when it appears.
Filters both, by checking whether history says the gap has closed through spot moving to the model, or the model moving to spot.
It is what separates a screen from a trade idea. Signal generation is not profit and loss — monetisation still needs sizing and risk management on top.

The same fixed thresholds, applied mechanically, across equities, rates, FX and commodities. Signals taken at a fair value gap of ±1σ. Hit rates cluster in the high-50s to low-60s across the board.
Average returns vary far more by asset class — strongest in equities and commodities, thinner in rates and FX — which is what you would expect once you remember that hit rate measures direction, not magnitude.
Hit rates cluster, they do not spike. Consistency is the claim, not a headline number.
Compliance decision: hit rates are back-tested and hypothetical. They need the standard simulated-performance risk statement, a stated methodology (fixed ±1σ thresholds, 2010 to present, four asset classes, gross of costs), and confirmation the study is cleared for an open, ungated page. If not, this section becomes qualitative and the numbers move behind the contact form.
One engine, updated daily, across every asset class. No lagged releases and no manual rebuild each morning.
Stream signal flags, model value, factor sensitivities and fair value gaps straight into your own process.
Work from the pre-built screener in the Qi interface — rank the universe by factor, confidence or gap without writing anything.
Track a single idea live for two weeks and see whether the signal holds on your own universe before committing further.
Stock-level macro exposures for equity portfolios — measure unintended exposure, attribute returns and stress the book.
Systematic, rules-based indices, independently calculated and available to license — a macro alternative to passive allocations.