Test whether your residual
is really idiosyncratic
Take measured alpha to the allocator, not a residual.
Your risk model calls it residual — what was left once it had explained everything it could. That is not the same thing as alpha, and an allocator running their own factor analysis will find the difference before you do.
MFERM shows how much of that residual is macro, factor by factor and name by name, across around 20,000 instruments, updated daily, with daily history since 2009. What remains is genuinely yours — and can be shown to be.
An overlay, not a replacement. Our macro models complement the traditional factor model you already run — Axioma, Barra or your own — adding the macro axis those models read only indirectly. They measure rather than forecast: nothing depends on a house view or a call on where rates or oil go next. And they reveal what is actually driving performance, instead of leaving macro lumped into your residual.
Four things long/short desks use it for, drawn from client work across global and regional books.
Exposure & stress
MSR regime tells you when stock-picking pays.
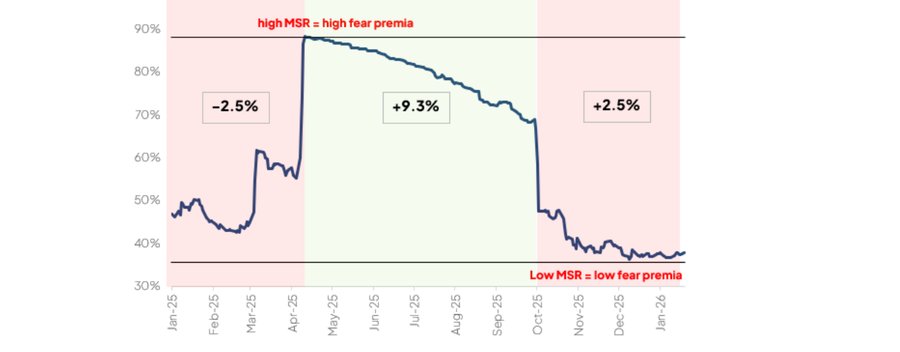
A global long/short fund, analysed on static weights over a year in which it returned 9.3%. Split by macro regime, that single number comes apart.
While Macro Share of Risk sat high — macro in charge, fear priced in — the book lost 2.5%. Through the middle band it made 9.3%. When MSR fell to its lows it added 2.5% more, with stock selection doing the work but the book increasingly exposed to a shock.
The same report surfaced a game of two halves — macro contributing 7.1% in the first, idiosyncratic return 11.1% in the second — alongside a credit divergence bet and a weak-dollar tilt nobody had described as such.
Fragility detection
Every long/short book has a momentum tilt.
Whether or not anyone chose one. And momentum crashes cluster where you would least expect them: not when macro is loud, but when it has gone quiet.
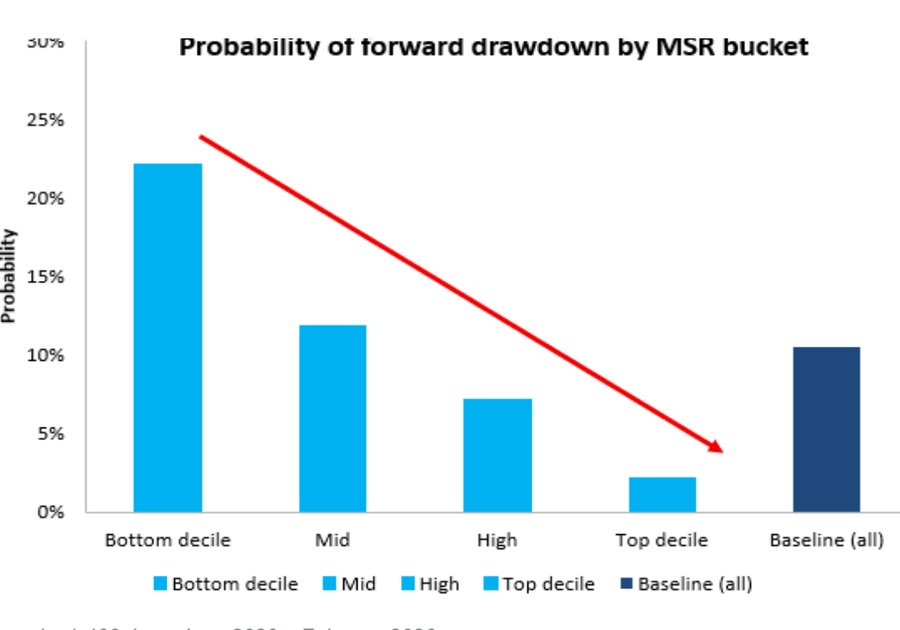
Sorting history by Macro Share of Risk, the bottom decile carries a 22% probability of a forward drawdown against a 10% baseline. The top decile carries 2%.
It mirrors on the short side. For a widely held short basket, bottom-30th-percentile MSR implies a 61% probability of a drawdown of 15% or more, against a 37% baseline; the top decile, 4%.
Exposure & stress
Visible a month before the shock.
A crude short nobody had put on, deepening quietly across a year. Essentially flat in January, −0.109 by March, −0.182 by September, and at a period extreme of −0.204 when the stress test was run in January 2026.
Priced before the event, a supply shock of 20% modelled at −227bps on its own. With cross-factor amplification — oil pulling volatility up, high yield wider, inflation higher — the combined hit modelled at roughly 300bps.
The exposure was measurable and the report was actionable, a month before the event that made it expensive.

Allocation & construction
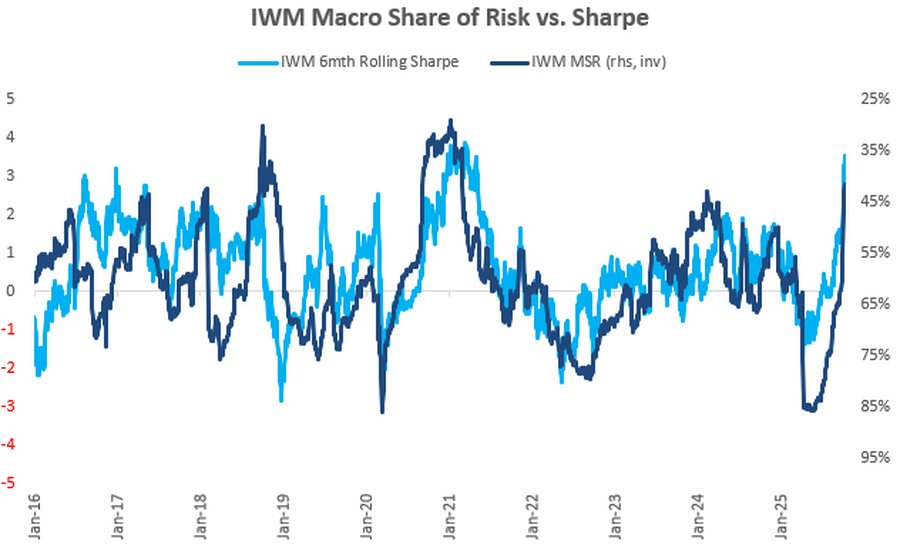
Rising MSR is a Sharpe pollutant.
Two institutions — a US asset manager above $1trn and a Canadian pension fund — run the same overlay on top of their own style factor models.
Hit the style exposure limits first. Then rank every stock by Macro Share of Risk, daily, across the universe. Then apply a penalty function: above 70% MSR, reduce; below 30%, boost.
Style says what bet you are making. MSR says how much of that bet is actually being expressed.
Consent needed: These examples come from the confidential use-case deck and describe identifiable client mandates. Anonymised as above they are usable, but each client should sign off before publication. Simulated and modelled results are labelled as such and need the standard risk statement.